
West Northamptonshire averaged £292,754 in June, £508 under England's and closer than any other district. Terraces rose 3.5%, flats did not move.
Update, 19 September: the July release has revised these figures down. June now stands at £291,415 and May at £292,274, so May is no longer the record month described below. Our report on the July figures has the details.
The average home in West Northamptonshire sold for £292,754 in June, according to figures HM Land Registry published on 19 August. That is £7,059 more than a year earlier, a rise of 2.5%.
It also puts the district £508 below the England average of £293,262. Work through the full June index, which carries all 295 English local authority districts, and no other district sits closer to the national figure. The next nearest, Medway, is £2,920 away.
The month prices actually peaked was May
June was not a record. May was, and only after the Land Registry went back and revised it.
- May 2026 was first published at £292,495, an annual rise of 1.8%.
- The June file revises it to £293,565, an annual rise of 2.1%.
- That is £1,070 added to a month already in print, and it makes May the highest monthly average in the district’s series.
- June then came in £811 below the revised May figure, a fall of 0.3% on the month.
Revisions like this are routine. The Land Registry keeps adding completed sales to a month after it first publishes the figure, so the first release of any month is provisional. Our house prices page carried the original May number, and has now been updated to the revised one.
Terraces and semis are doing the work
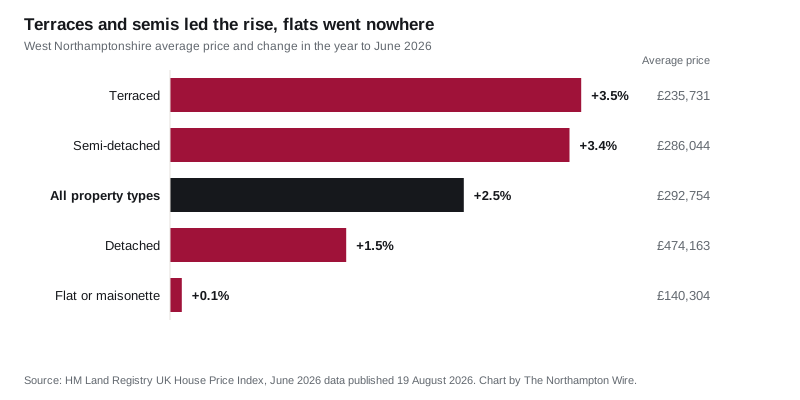
The headline average hides four very different markets.
| Property type | Average price | Change on June 2025 |
|---|---|---|
| Terraced | £235,731 | +3.5% |
| Semi-detached | £286,044 | +3.4% |
| Detached | £474,163 | +1.5% |
| Flat or maisonette | £140,304 | +0.1% |
Flats have effectively stood still for a year. They are also the one type still well short of where they were: the district’s flat average peaked at £148,147 in December 2022 and is now £7,843, or 5.3%, below that.
For anyone buying a first home, the index puts the West Northamptonshire first-time buyer average at £242,812, up 3.0% on the year.
How the neighbours compare
Every figure below comes from the same June file, so they are measured the same way.
| Area | Average price | Change on June 2025 |
|---|---|---|
| Bedford | £329,830 | +4.4% |
| Cherwell | £353,632 | +3.8% |
| Milton Keynes | £325,104 | -0.1% |
| North Northamptonshire | £256,610 | +3.4% |
| Rugby | £276,208 | +0.2% |
| East Midlands | £240,457 | +2.4% |
West Northamptonshire ranks 160th of the 295 English districts on annual change, close to the middle. Sixty-two of those districts recorded a fall over the year. Milton Keynes, at -0.1%, is one of them.
What it means for you
If you are selling. The district average has moved £811 in the wrong direction in a month and £7,059 in the right one over a year. Neither is large enough to justify a change of plan. What matters more is which of the four markets above your home sits in. A terrace and a detached house in the same street have had very different years.
If you are buying a flat. Prices are 5.3% below the December 2022 peak. That gap is unusual here. Detached, semi-detached and terraced homes in the district all set their record average in May 2026, the month just gone. Flats set theirs three and a half years ago.
If you are comparing with an estate agent’s figure. UKHPI is a mean average, not a median, and it is built from sales that have completed and been registered. It is not asking prices, and a handful of expensive sales pull a mean upward in a way they would not pull a median.
If you want the town rather than the district. The index area is the whole unitary authority, from Northampton out to Towcester, Brackley, Daventry and the villages. Northampton’s own postcodes sit below it. Our Northampton house prices page sets out both figures and what the gap is made of.
One caveat on volumes. The Land Registry leaves the sales count blank for the two most recent months, so the newest publishable figure is 311 sales in April 2026, against 269 in April 2025. Prices for May and June are published; the number of sales behind them is not, yet.
Planning decisions shape what gets built here next, and we track those on our Northampton planning news page.
Have your say